

How to Build an XmR Chart (with Excel)
On Sale
$0.00
Pay what you want:
$
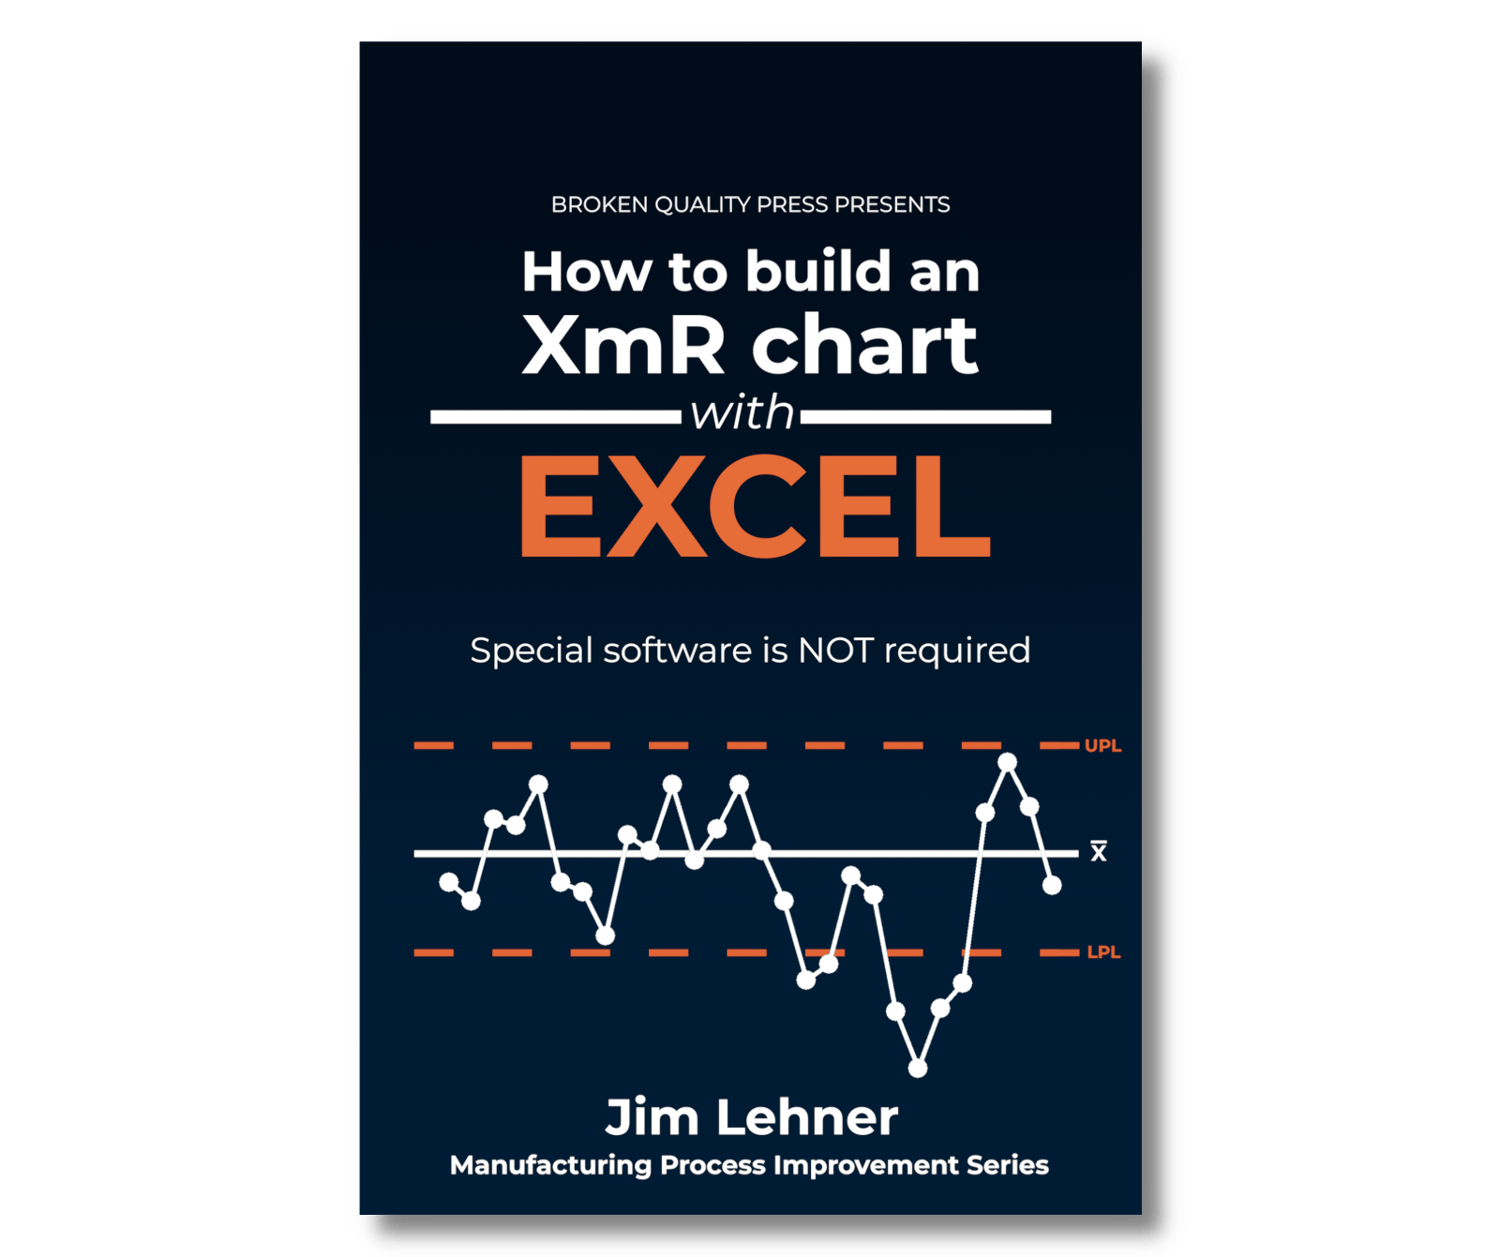
It is often assumed that the process behavior chart can only constructed using special software like Minitab or JMP. This could not be further from the truth. Excel is more than capable of this task. As proof of this point, How to Build an XmR Chart with Excel, walks you through the six step process of constructing an XmR chart in Excel. Along the way you will learn how to:
- Import data using power query
- Leverage useful table behaviors like automatic table expansion and formula filling
- Apply conditional formatting to tables
- Change the color of markers with values that fall outside the process limits
- Characterize process behavior
- Discriminate between the two types of variation using an XmR chart
Stop letting the lack of special software hold you back. Start using Excel.